Statistical Resources
for Educational Research
Standard Deviation
Range and Normal Distribution
Variability
Variability reflects how scores differ from one another. Variability can also be thought of as a measure of how much each score in a group of scores differs from the mean (average). Together, variability and average, are used to describe the characteristics of a distribution.
Range
The Range is the difference between the maximum value and the minimum value. It tells how far apart scores are from one another in a distribution.
It is calculated by simply subtracting the lowest score in a distribution from the highest score. r = h - l
-
r is the range,
-
h is the highest score,
-
l is the lowest score
Example: 3, 3, 4, 5, 5
r = 5 - 3
r = 2
Standard Deviation
The Standard Deviation represents the average amount of variability in a score. It is the average distance from the mean.
The larger the Standard Deviation, the larger the average distance from each data point is from the mean of distribution.
-
It is calculated using the following formula:
http://mathematicalmusings.pressible.org/nhw2108/understanding-standard-deviation
Normal Distribution
Data can be "distributed" (spread out) in different ways.
Spread more to left more to right
or all jumbled
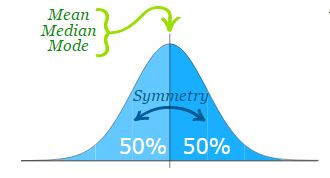
We say the data is "normally distributed":
The Normal Distribution has:
-
mean = median = mode
-
symmetry about the center
-
50% of values less than the mean
-
and 50% greater than the mean

Standard Deviation
Calculating Standard Deviation using Excel & SPSS
But there are many cases where the data tends to be around a central value with no bias left or right, and it gets close to a "Normal Distribution" like this:

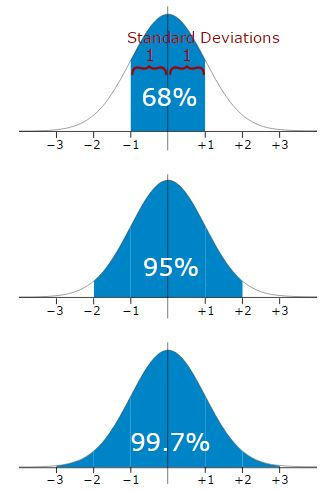
When we calculate the standard deviation we find that (generally):
68% of values are within 1 standard deviation of the mean
95% of values are within 2 standard deviations of the mean
99.7% of values are within 3 standard deviations of the mean